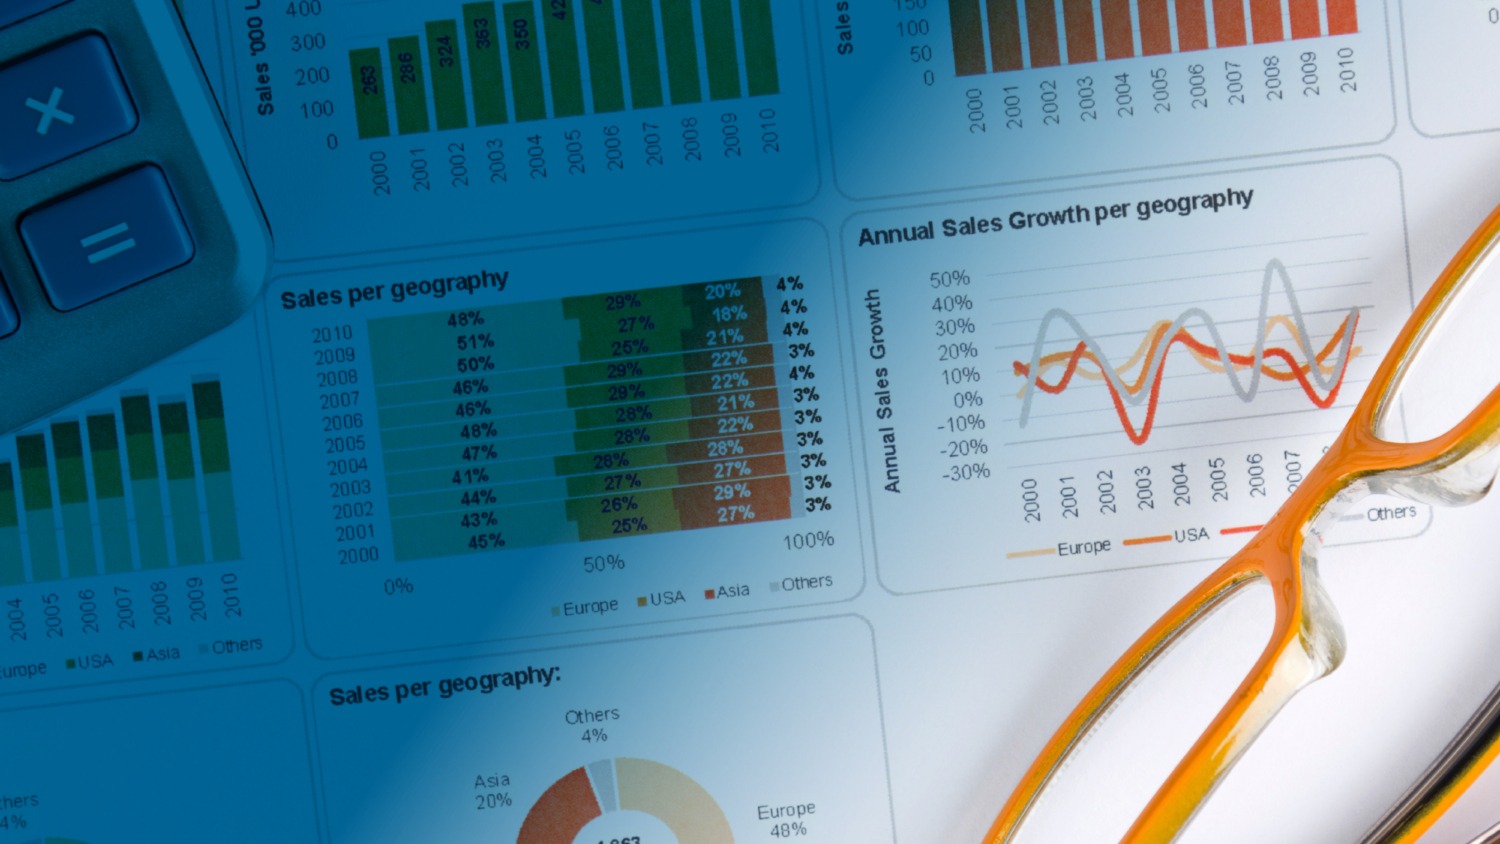

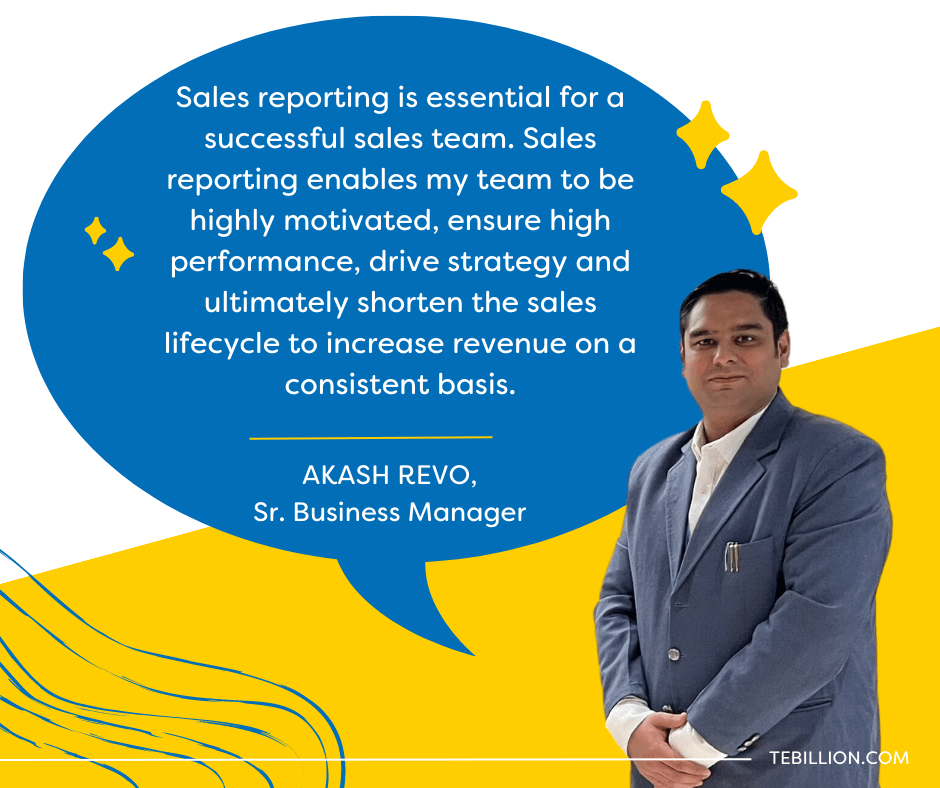
Less then 50% of sales leaders and teams have a high confidence in their organisation's forecasting accuracy, shared by Donnelly. The best sales managers and highest-performing sales teams will fully embrace sales reporting and forecasts to get insights into the foundations of their processes. This article will look at what sales reporting is and why it is so crucial to your success.
Sales reporting is the collection of data that will help a business evaluate its sales performance. Sales reports can include:
By tracking these metrics, your sales managers and leaders will be able to understand their processes, forecast their performance and strategize effectively.
By fully embracing sales reporting, your business will inherit crucial benefits such as:
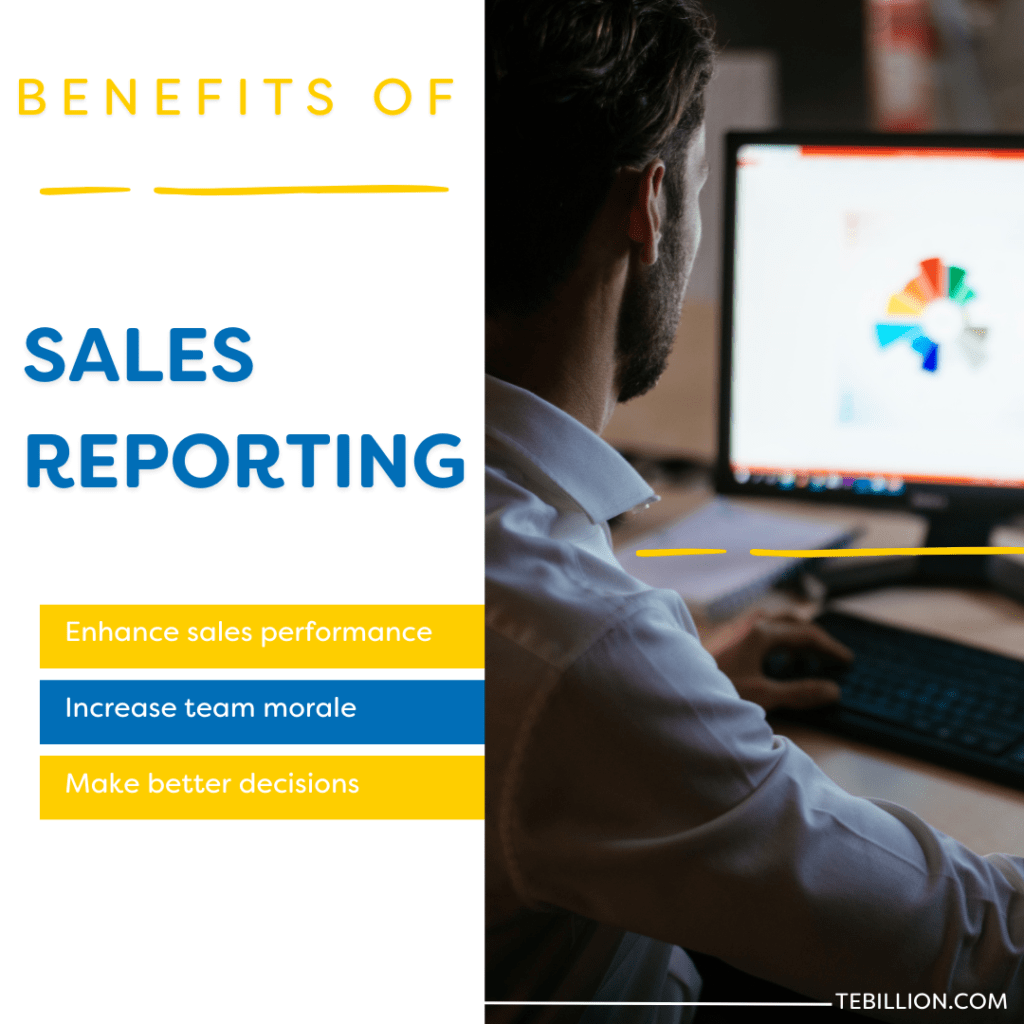
Sales reports will give you insights into the performance of each sales representative in your business. As a result, you will be able to clearly identify team members that need extra coaching and support to reach their full potential. Furthermore, you will be able to spot areas of your sales process that can be improved by better efficiency, helping your business drive its sales.
Sales reporting will guide your team through their workload, helping them focus on the high-quality tasks that need to be prioritised. By guiding your team to complete more fulfilling tasks, their morale will increase. Gallup found that sales teams with high morale were found to be 23% more profitable to a business.
Sales reports will provide you with the sales data needed to make informed, data-driven decisions. You will be able to base your sales strategy on these reports, making insightful decisions around how your business is performing.
Here are the most common types of sales reports that businesses use to help their strategy and stay informed about their performance:
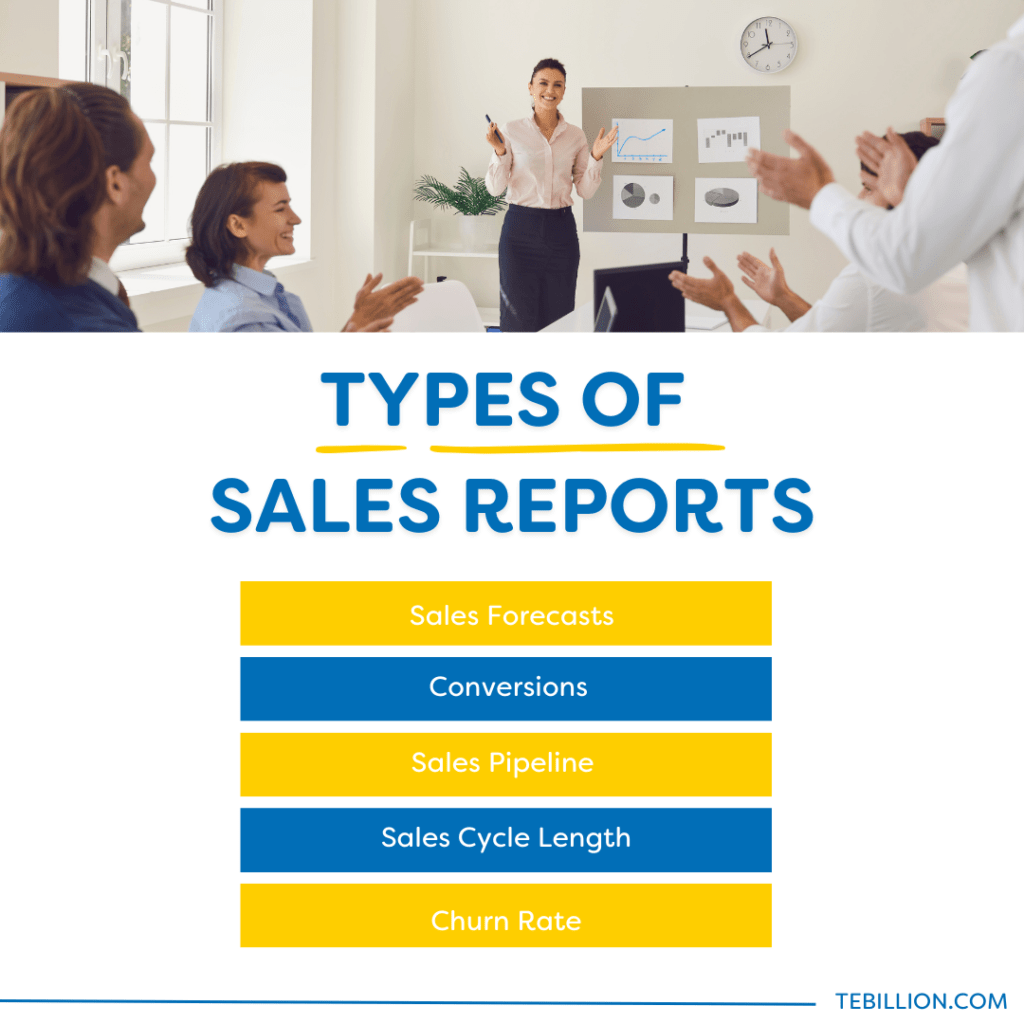
Sales forecast reports – These reports will predict the number of sales you will make over a certain time period, helping you plan for the future.
Conversion reports – Conversion reports will give you insights into how your sales funnel is performing with the number of leads you are converting and the efficiency with which this is being done at.
Sales pipeline reports – These reports will help your business be in the know about your pipeline health, showing you the deals that are likely to be closed, and the impact each one will have on your business.
Sales cycle length reports – Track the average length of your sales cycle to get a good understanding of how your sales representatives are performing, and how their efficiency could be improved.
Churn rate reports – Find out how your business is performing when it comes to retaining customers. This will help you identify cross-selling and up-selling opportunities while giving you a good understanding of the customer experience you provide.
To create a great sales report, you need to follow these tips:
A sales report should begin with an overview of the information that will be covered in the report and the key takeaways from it. To do this, you must have a clear idea of what the goal of the report is.
You should determine early on what time frame your sales report will cover, whether it is daily, weekly or monthly statistics.

Daily sales reporting statistics can include:
Weekly sales reporting statistics to include are:
Monthly sales reporting statistics you should include are:
Included in your sales report should be a section that is solely based on the important numbers you have gathered. For example, the number of deals won, leads generated and more should all be included in this section so it is easy to identify how your business is performing on a numeric basis.
Graphs and charts should be used in your sales reports to make them easily accessible to readers, helping your sales team and management get the important information they need in a streamlined way.
To streamline your sales reporting, you should consider adopting CRM software. CRM software will give you the ability to use filters to create custom reports to generate the type of report your business needs which can include graphs and charts for easy analysis. This saves a significant amount of time and resources compared to creating a sales report manually.
TEB is a sales automation CRM software that will give you every report your business needs to enhance its performance. TEB has a unique feature that will allow your business to generate custom reports on any area you want to learn more about. For example, here are just a few areas you can generate reports on:
Furthermore, TEB has game-changing benefits such as:
Want to see all of these features for yourself? Book a demo and with just 30 minutes of your time, you can see how TEB will help you take your business to new heights.